
Check the supply behind market cap
Market cap multiplies price by the supply basis used by the source; FDV uses a fully diluted basis. Two valuations can differ because of supply even when the price matches. See the terminal’s market-data fields for the labels used in the workspace.
Illustrative example: At a price of $0.002, 100 million circulating units imply $200,000 market cap. A total supply of one billion units implies $2 million on that supply basis. This is illustrative arithmetic, not a live token.
The documented Robinhood calculation uses contract totalSupply, not independently verified circulating supply. Solana source-reported market cap and FDV remain distinct fields. Check which one a filter uses before comparing ranges.
Compare liquidity by pool
Reported liquidity describes value in one pool. It is not a quote for selling your position at the displayed price.
For an order, check its size-specific quote, price impact, route and minimum received. Use the trade-cost calculator for fee arithmetic, separate from the pool’s executable price.
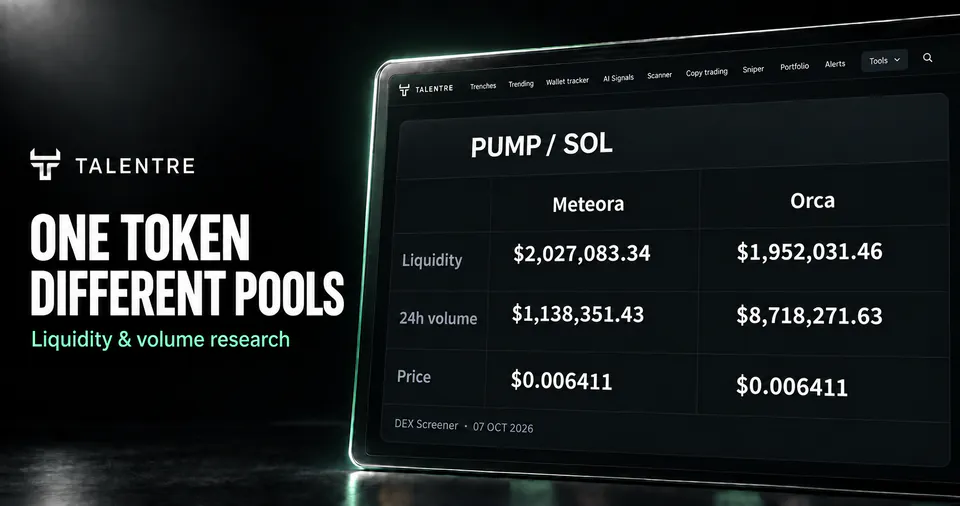
Compare a Solana token’s Wrapped SOL pools by reported liquidity and 24-hour volume. The comparison method identifies which records enter the totals.
The Robinhood adapter does not supply a pool-liquidity field. A missing value cannot support a liquidity comparison.
Volume needs a pool and a period
Volume is traded value during a stated interval. It does not measure net inflow, unique traders or realised profit. A large daily total can coexist with little recent activity.
Illustrative example: A pool reports $120,000 in 24-hour volume and $500 in the latest five minutes. Dividing the daily total by 288 gives $416.67 per five minutes as a daily average, not the measured activity in any earlier five-minute interval.
The Solana three-column workspace displays five-minute volume and buy/sell counts for the selected market. Its source can also carry a separate 24-hour volume field; the daily total must keep its own label. Robinhood activity uses a five-minute log window. Compare identical intervals and markets, without treating a daily ranking as five-minute activity.
Trade counts are not dollar flow
Illustrative example: A window contains 70 buys and 30 sells, so buys represent 70% of the trade count. If the buys total $700 and the sells total $3,000, the count ratio still remains 70%. The ratio alone cannot establish positive net buying value.
One participant can make many trades. Counts do not identify unique wallets, insiders or common ownership. A signal based on counts should be read as a count-based condition.
See the signal rules and an evaluation example to distinguish a trigger from an interpretation.
Resolve a disagreement between screens
| Check | Question |
|---|---|
| Identity | Are the network and full token address identical? |
| Market | Are the pool and quote asset the same? |
| Time | Do both figures use the same period and observation time? |
| Supply | Is the field circulating market cap, total-supply valuation or FDV? |
| Source state | Is either value cached, approximate or unavailable? |
Compare two PUMP/SOL pools in a timestamped source snapshot to see how the same token and quote can still produce different pool measurements.
If those match and the discrepancy remains, keep both source references and timestamps when reporting it to support@talentre.tools. DEX Screener’s API reference (opens in a new tab) lists the separate pair-level fields; Talentre’s methodology explains their use in the documented feeds.
Find your next research target